Your Habits dashboard shows you a set of behavioral scores based on feedback from the people you work with every day. Each score reflects how consistently you demonstrate a specific professional behavior, as observed by your feedback circle. This guide explains what each part of the dashboard means and how to interpret your results.
Opening Your Habits Dashboard
- Log in to Engage at app.humareso.com.
- Click Habits in the left sidebar. This opens the My Habits view, which is the default tab.
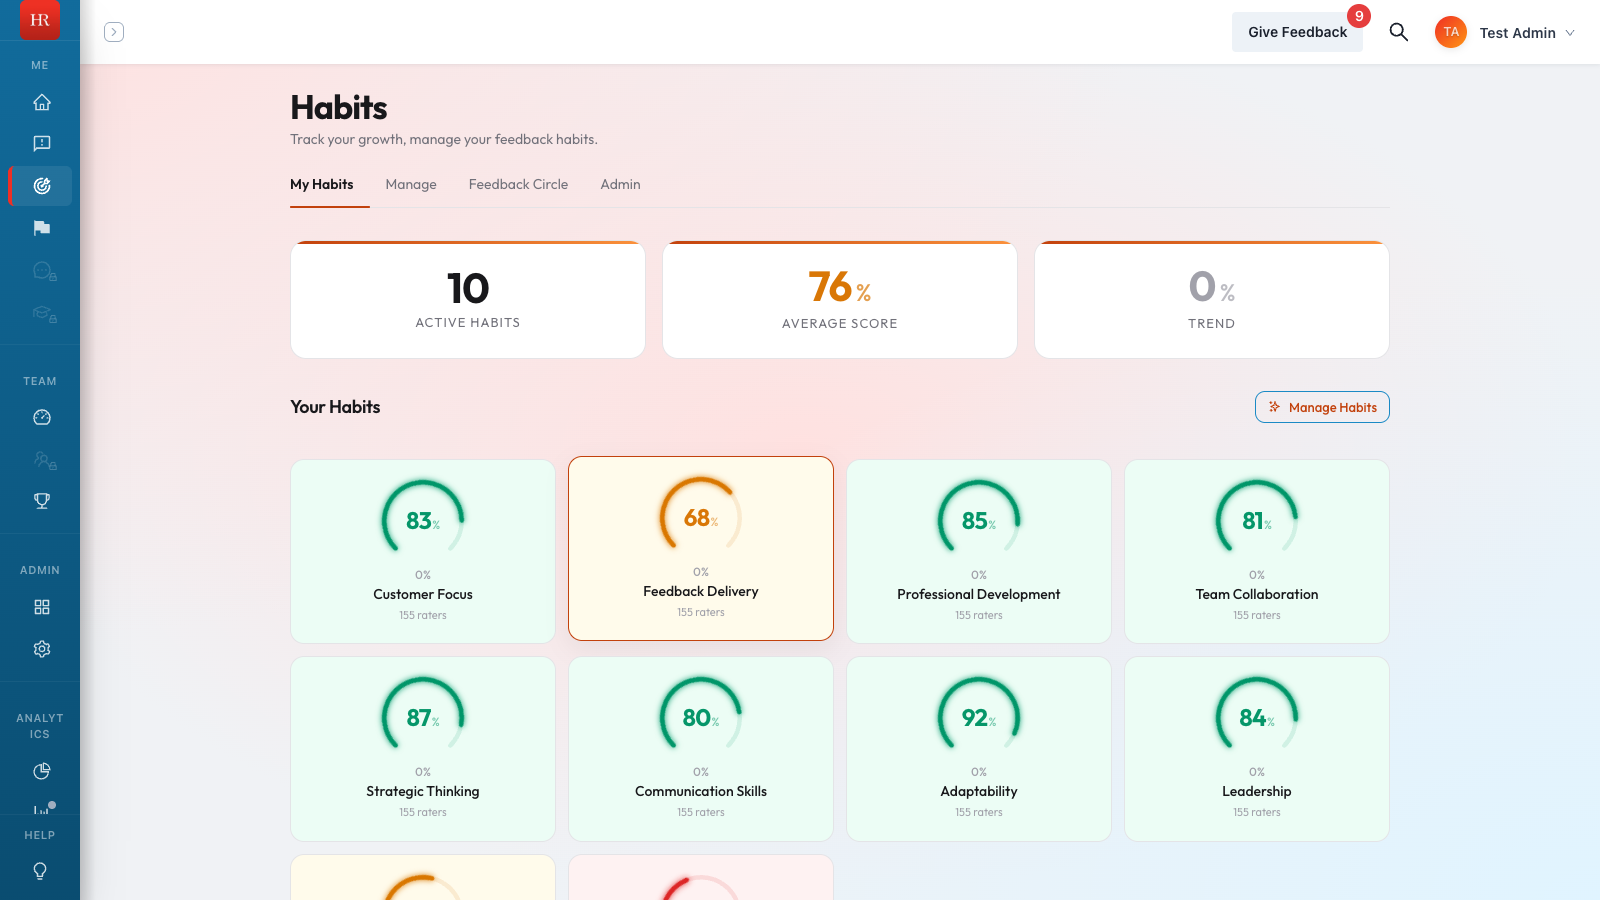
You will see a card for each habit assigned to you, organized into groups set by your administrator. Each card shows the habit name, your current score, and a directional indicator showing whether your score is trending up or down.
Understanding the Score Circle
Each habit displays a three-quarter circle gauge with your score on a 0 to 100 scale. The score represents the percentage of positive behavioral observations from your feedback circle over your selected time window.
- 90 to 100 (Excellent). Shown in green. You are consistently demonstrating this behavior according to your peers.
- 65 to 89 (On Track). Shown in yellow or blue. You are demonstrating the behavior most of the time with room to grow.
- 0 to 64 (Needs Work). Shown in red or orange. Your feedback circle is observing this behavior less frequently. Review the behavior breakdown to identify specific areas to focus on.
If a habit shows a dash instead of a number, it means the system is still collecting enough feedback to generate a reliable score. A progress bar beneath the circle shows how close you are to unlocking the score.
How Scores Are Calculated
Your score is based on responses from people in your feedback circle. Each rater answers behavioral questions about you using one of three options:
- Yes (counts as 1 point)
- Sometimes (counts as 0.5 points)
- No (counts as 0 points)
The system totals the points, divides by the number of responses, and multiplies by 100. For example, if five raters answer and the total is 3.5 points, your score would be (3.5 / 5) x 100 = 70.
Responses of Don't Know are excluded from the calculation entirely. Recent feedback is weighted more heavily than older feedback, so your score naturally reflects your most current behavior.
Score Time Windows
Your dashboard displays your score for the time window you select. Four options are available:
- Last 4 Weeks shows your most recent behavior snapshot.
- Last 3 Months (Last Quarter) is the default and most commonly used view.
- Last Year provides a broader trend view.
- All Time includes every response ever collected for this habit.
Within each time window, recent feedback carries more weight than older feedback. This means your score responds to real changes in your behavior rather than being anchored to past results.
Unlocking a Habit Score
A habit score remains locked until three conditions are met:
- Minimum raters. At least three people in your feedback circle must have accepted the invitation and started providing feedback. Your organization may require more.
- Enough responses. The total number of valid responses across all behaviors in the habit must reach the unlock threshold. This threshold is based on the number of behaviors multiplied by a factor set by your administrator.
- All behaviors scored. Every behavior within the habit must have generated at least one score.
While a habit is locked, you will see a progress bar showing your percentage toward unlock. Once all conditions are met, the system calculates your initial score and the habit circle fills in with your result.
Viewing the Habit Detail Page
Click any habit card to open the detail view. This page provides a deeper breakdown of your performance:
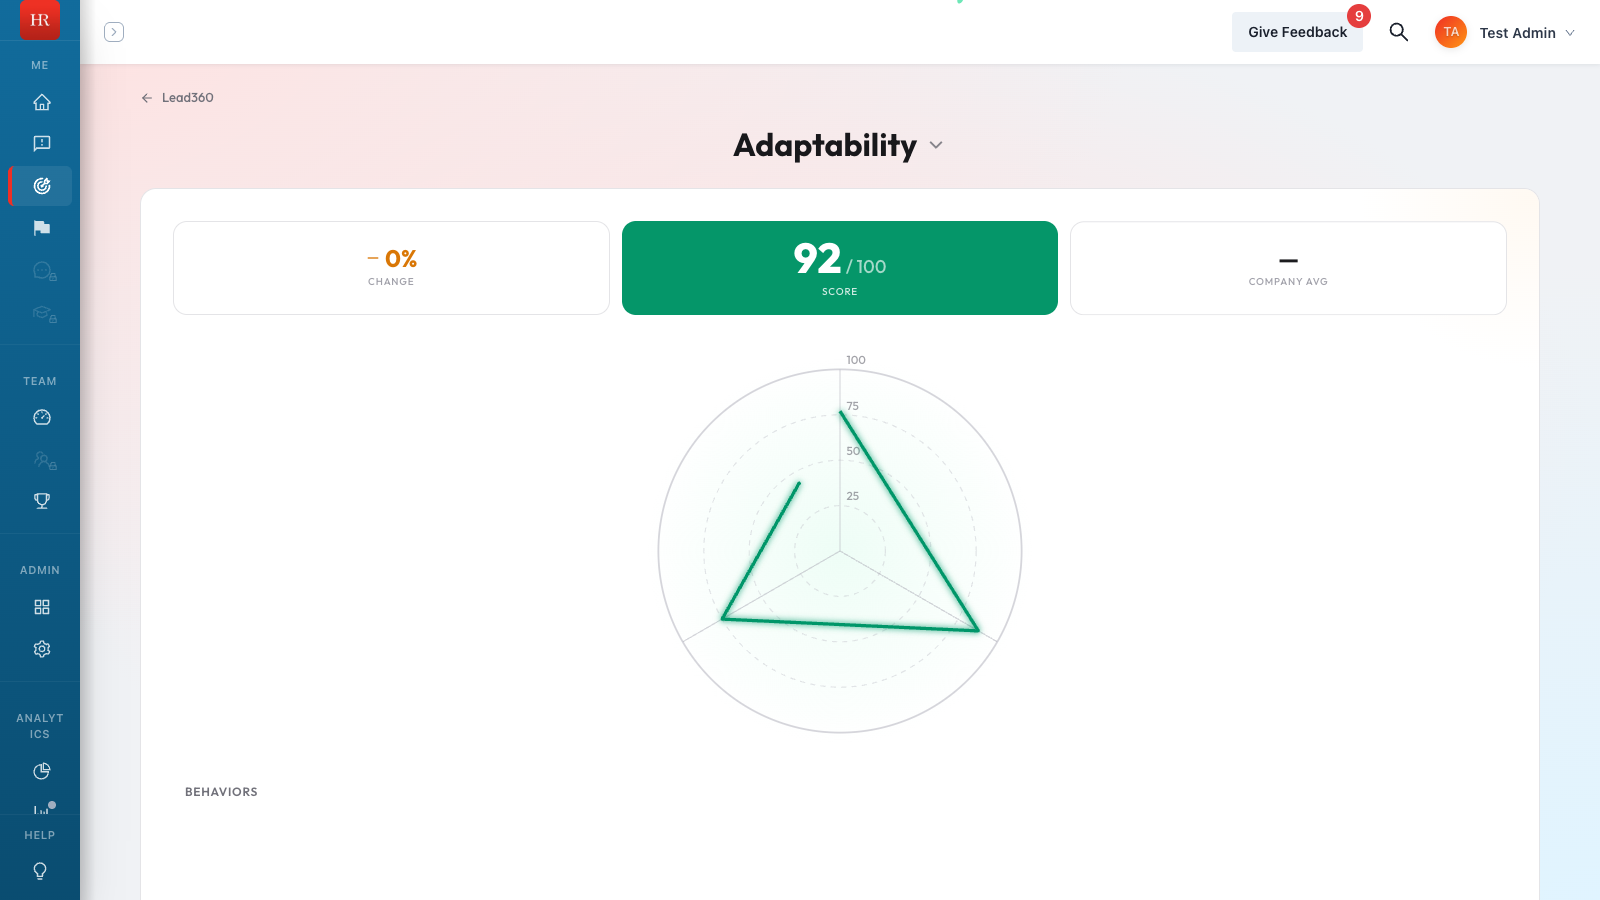
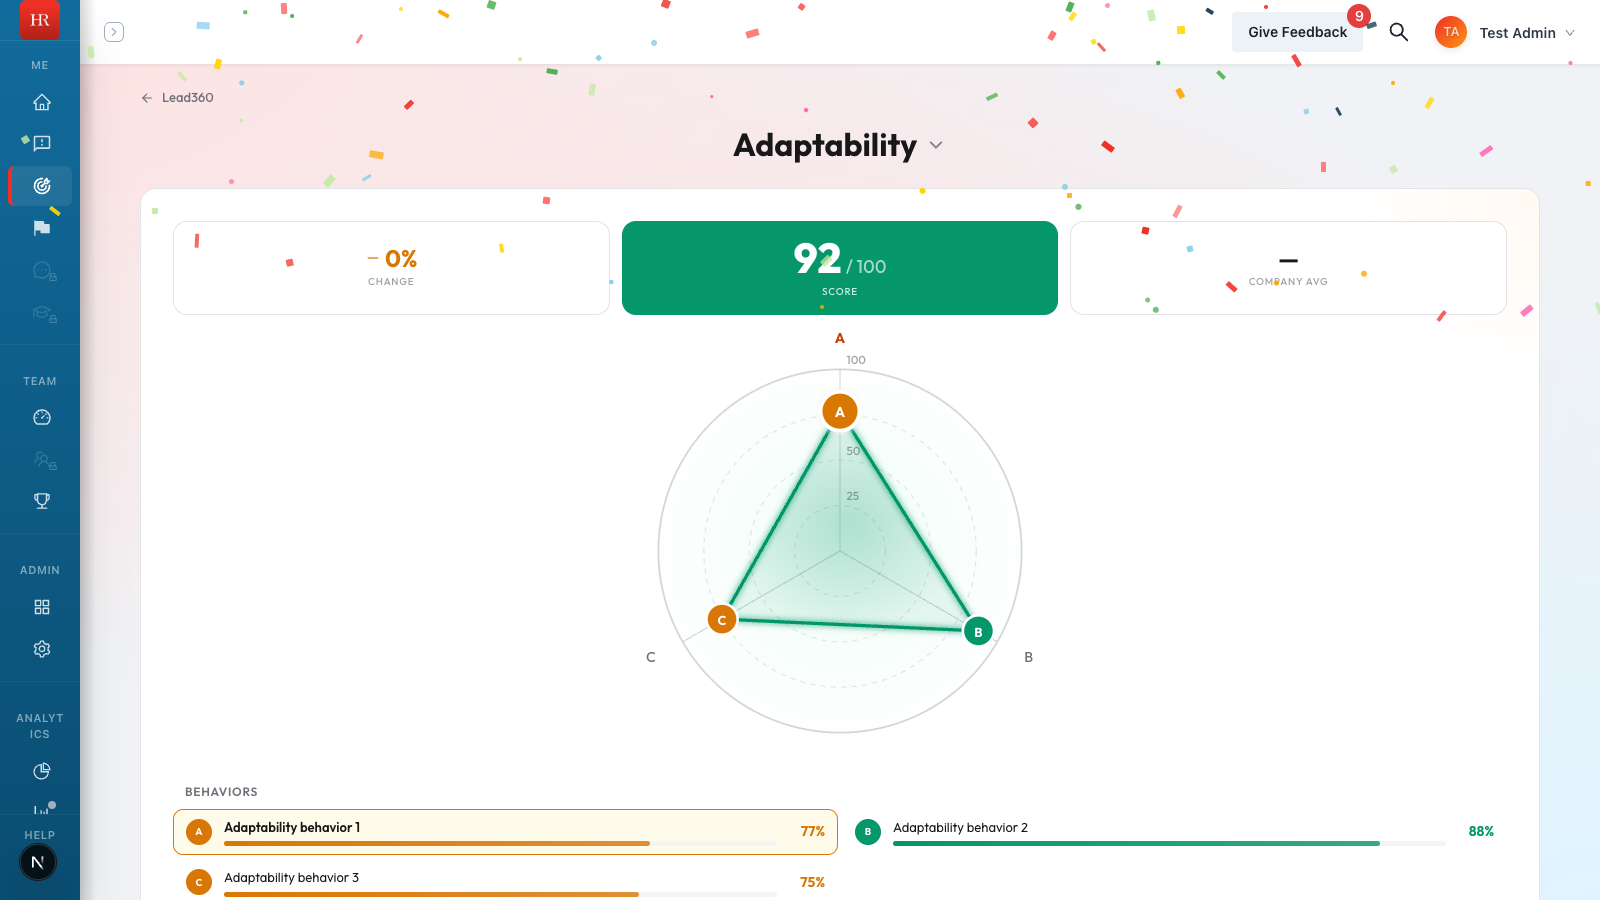
- Radar chart. Shows your score for each behavior within the habit. The shape of the chart reveals which behaviors are strong and which need attention.
- Trend line. A line graph tracking your score over time. You can switch between Last Quarter, 6 Months, 1 Year, and 2 Years to see different spans.
- Company average. A reference line showing the average score across your organization for this habit. Use it to see how you compare to peers.
- Improvement suggestions. Tips, articles, videos, and microlearning modules related to the habit, tailored to help you improve in the areas where your score is lowest.
What You Will See When Scores Change
When new feedback comes in and your score updates, the dashboard shows a directional arrow next to the score. A green upward arrow means your score improved since the last calculation. A red downward arrow means it decreased. No arrow means the score is stable.
A notification badge appears on the habit card when new feedback has arrived that you have not yet reviewed. Click into the detail view to see your updated scores and clear the notification.
Viewing Someone Else's Habits
If you are a manager, you can view the habits of people on your team by navigating to their profile and selecting the Habits tab. Admins can view any user's habits across the organization. Regular users can only view their own habits.
Tips
- Check your habits weekly. Scores update as new feedback arrives, and staying current helps you spot trends early.
- Use the radar chart on the detail page to identify the specific behaviors driving your overall score. A high habit score with one low behavior is more actionable than a uniformly average score.
- If your score is locked, ask your manager to ensure you have at least three active raters in your feedback circle.
- The trend line is the most important indicator. A score of 75 that is trending upward from 60 tells a better story than a static 85.